Heated Apparel Pricing 2026: Retail Buyer Landed Cost & Margin Guide
Introduction: Why 2026 Heated Apparel Pricing Demands a Retail-Buyer Playbook
If you price heated apparel the way you did in 2022, the 2026 season will eat your margin. Battery cells have re-priced twice in 18 months, the EU has tightened GPSR compliance, and retailers now expect plug-and-play private-label programs with batteries, chargers, and packaging bundled into one FOB quote. That’s why heated apparel pricing in 2026 is less about chasing a per-unit FOB and more about a defensible landed cost model and clean margin waterfall.
This guide is the retail buyer counterpart to our MOQ article from yesterday. Where that covered minimum order thresholds, this walks the wholesale price ladder down to the MSRP shelf tag — so you can open a vendor quote, build a landed cost model in 15 minutes, and defend a 2.6x–3.2x markup at the merchant meeting.
We cover the manufacturer cost stack, OEM archetype differences, wholesale tier ladders, the 12V vs 5V heated apparel system cost question, hidden add-ons, channel-specific MSRP strategy, a 5-step negotiation playbook, an 8-row vendor pool scorecard, seasonality, and LC vs OA pricing tie-in math. For deeper benchmarks, see our heated apparel sourcing index.
The Heated Apparel Manufacturer Pricing Stack: 9 Cost Lines a Buyer Sees
Every credible heated apparel manufacturer quote in 2026 should decompose into nine cost lines. A single FOB figure with no breakdown is a red flag — you cannot negotiate what you cannot see. The stack also gives you a defensible answer to the merchant meeting question “where did this $19.50 come from?”
| # | Cost Line | % of FOB | Buyer Question |
|---|---|---|---|
| 1 | Garment shell + lining | 22–28% | GSM? Recycled content? |
| 2 | Heating element (carbon / metal fiber pad) | 6–10% | Element zones, wash rating? |
| 3 | Wiring harness + connectors | 3–5% | QC disconnect rate? |
| 4 | Battery pack (cell + BMS + housing) | 28–38% | Cell brand (LG / BAK / EVE), mAh, cycle life? |
| 5 | Charger + USB-C cable | 2–4% | Region plug (US/EU/UK)? |
| 6 | Controller + LED push-button | 2–3% | 3-level vs app-controlled? |
| 7 | Trim (zippers, snaps, reflective tape) | 5–8% | YKK vs generic? |
| 8 | Labor + assembly | 8–12% | In-house vs subcontracted? |
| 9 | Manufacturer overhead + margin | 6–12% | Audit-friendly P&L? |
Line 4 — the battery pack — is the swing factor in 2026. A 7.4V / 5000 mAh BAK pack can swing FOB by $2.40–$3.80 per unit. That’s why an OEM-direct heated apparel manufacturer with in-house pack assembly is structurally cheaper than a layer-2 broker.
> Working with an OEM-direct heated apparel manufacturer can shave 18–24% off retail landed cost versus a layer-2 broker, with one throat to choke on warranty claims.
Heated Apparel OEM Pricing: 5-Archetype Manufacturer Comparison
Not every heated apparel OEM is built the same way. The archetype map below is what retail buyers should screen against before issuing an RFQ.
| Archetype | Description | FOB vs Market | Strength | Risk |
|---|---|---|---|---|
| A. Vertically integrated OEM | Owns factory + battery line + R&D | Lowest FOB | One-vendor accountability | Higher MOQ |
| B. Garment OEM + 3rd-party battery | Strong apparel, sources battery | Mid FOB | Apparel quality | Battery warranty finger-pointing |
| C. Battery OEM + outsourced garment | Strong battery, sources garment | Mid-High FOB | Battery tech | Garment QC inconsistent |
| D. Trading company / broker | No factory, sources everything | Highest FOB | Low MOQ, fast response | Zero IP control |
| E. Western brand OEM partner | US/EU brand outsourcing to vetted Asian factory | Premium FOB | Compliance maturity | Limited peak-season capacity |
Your first decision is unit cost (Archetype A) vs cycle-time flexibility (Archetype D). For a 2,500-unit fall push with a hard August delivery, you usually need B — a heated apparel OEM with strong garment roots and a known battery sub-supplier.
Heated Apparel Wholesale FOB vs Landed: Building the Heated Apparel Landed Cost Model Bridge
The biggest mistake retail buyers make is comparing FOB quotes without bridging to landed. Heated apparel wholesale pricing only makes sense when FOB is just the starting line and the heated apparel landed cost model you build on top is step two.
| Layer | What It Covers | US (Long Beach) | EU (Rotterdam) | UK (Felixstowe) |
|---|---|---|---|---|
| Layer 1: FOB | Garment + battery + trim + assembly | $19.50 | $19.50 | $19.50 |
| Layer 2: Freight + duty + insurance | Ocean freight, insurance, customs duty, broker | $3.20 | $3.85 | $3.95 |
| Layer 3: Last-mile + handling | Drayage, warehousing, inbound QC, 3PL pick | $2.10 | $2.40 | $2.55 |
| **Landed Cost** | — | **$24.80** | **$25.75** | **$26.00** |
The UK looks 5% more expensive on landed cost, but it sidesteps the EU’s new GPSR product-safety representative overhead, which adds another $0.40–$0.60/unit at retail registration for smaller SKUs.
Retail Buyer Heated Apparel Guide: SKU Selection by Channel (Outdoor / Workwear / Lifestyle)
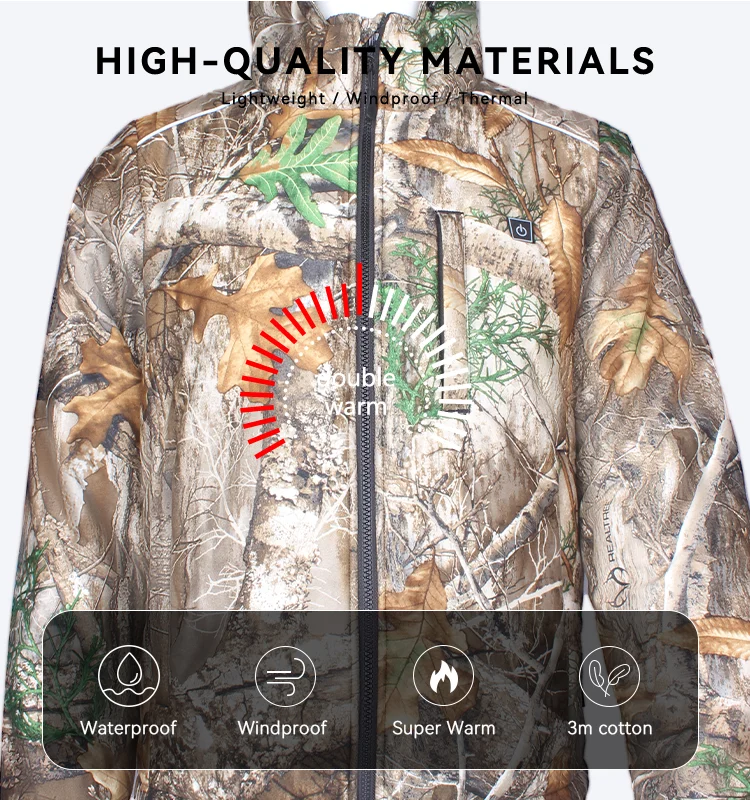
A practical retail buyer heated apparel guide starts with channel — the same vendor’s jacket lands at $59 MSRP in outdoor specialty, $79 in big-box workwear, and $129 in lifestyle DTC. The pricing math is the same; what changes is the marketing envelope, warranty term, and battery spec.
| Channel | Target MSRP | Battery Spec Required | Heat Zones | Color Story |
|---|---|---|---|---|
| Outdoor specialty (REI, Bass Pro) | $79–$129 | 7.4V / 5000–10000 mAh | 5–7 zones | Earth-tone, blaze orange |
| Workwear (Tractor Supply, Grainger) | $89–$149 | 12V with vehicle adapter | 4–6 zones | Hi-vis, black, navy |
| Lifestyle DTC (brand.com, Shopify) | $129–$199 | 5V slim-pack (USB-C) | 3–5 zones | Fashion palette, fitted |
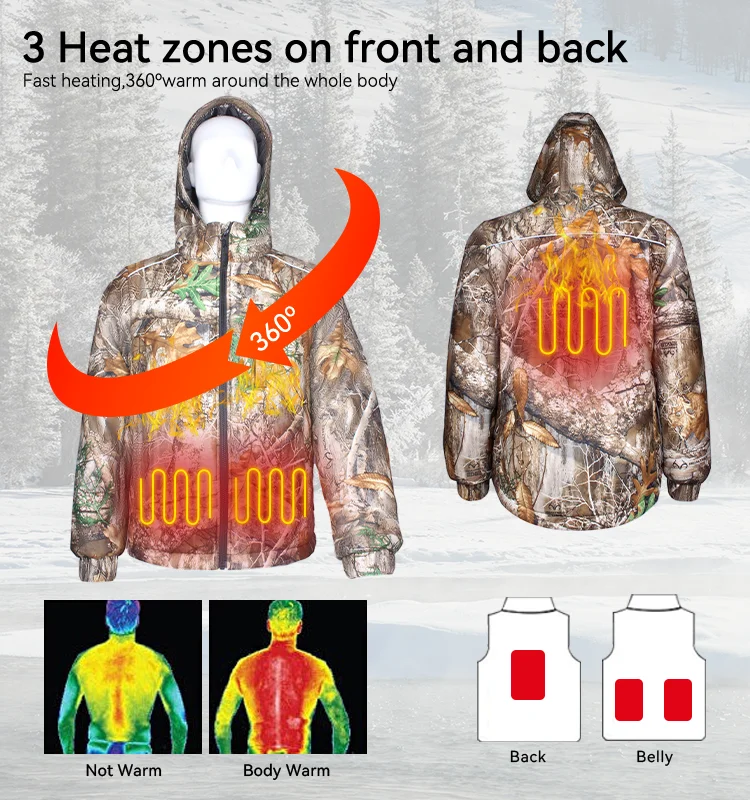
The highest-leverage SKU choice for 2026 is the 5V heated apparel system lifestyle vest: smaller box (lower 3PL pick fee), commodity USB-C battery (lower warranty reserve), and DTC margins 8–12 points better than 12V outdoor.
Heated Apparel Landed Cost Model: Freight, Duty, Last-Mile by Region (US/EU/UK)
The heart of the heated apparel landed cost model — the formula every retail buyer should defend at the merchant meeting.
Landed Cost Formula (per unit):
`Landed = FOB + Ocean Freight + Marine Insurance (0.3% of CIF) + Duty (HTS × CIF) + Broker Fee + Drayage + Warehousing + Inbound QC + 3PL Pick Fee`
For HTS 6101 (men’s jackets) US duty is 27.7%; heated apparel is more often classified under 6110 (knit garments) at 32% — or the vendor uses first-sale valuation to knock 8–14 points off dutiable value. Always ask.
| Region | FOB | Ocean Freight | Duty (effective) | Last-Mile | **Total Landed** |
|---|---|---|---|---|---|
| US (Long Beach) | $19.50 | $2.10 | $1.10 | $2.10 | **$24.80** |
| EU (Rotterdam) | $19.50 | $2.55 | $1.30 | $2.40 | **$25.75** |
| UK (Felixstowe) | $19.50 | $2.60 | $1.40 | $2.55 | **$26.00** |
| US (airfreight — emergency) | $19.50 | $8.40 | $1.10 | $2.10 | **$31.10** |
> Our heated apparel wholesale sourcing guide benchmark suggests freight in Q3 2026 is running 4–6% above 2024 levels due to Red Sea rerouting and capacity tightening, so pad your landed cost model accordingly.
Heated Apparel Margin Waterfall: From FOB $19.50 to MSRP $79.99
The heated apparel margin waterfall is where pricing strategy either compounds or collapses. A buyer with great FOB but leak-y markdowns/returns/warranty reserves will underperform one with slightly worse FOB but tighter channel discipline. Each line below is where the FOB $19.50 gets defended or eroded.
| Line Item | Per Unit ($) | % of MSRP | Notes |
|---|---|---|---|
| FOB | 19.50 | 24.4% | Negotiated |
| Inbound freight + duty | 3.20 | 4.0% | Layer 2 |
| Last-mile + 3PL | 2.10 | 2.6% | Layer 3 |
| **Landed Cost** | **24.80** | **31.0%** | — |
| Retailer markup (2.6x landed) | 39.64 | 49.6% | Gross margin |
| Marketing / co-op | 6.00 | 7.5% | 12% of gross |
| Payment processing | 2.00 | 2.5% | 2.5% of MSRP |
| Warranty reserve (battery) | 2.50 | 3.1% | 4% of MSRP |
| Returns + markdowns | 4.50 | 5.6% | 8% of MSRP reserve |
| Warehousing + pick | 0.55 | 0.7% | 3PL contract |
| **Net Contribution** | **24.09** | **30.1%** | Before SG&A |
The 30% net contribution is realistic for outdoor specialty. Big-box compresses to 18–22%; DTC expands to 38–46% — but DTC carries CAC. A defensible heated apparel retail margin conversation always distinguishes gross markup (49–55%) from net contribution (28–34%).
12V vs 5V Heated Apparel System: Cost, Battery, Retail Channel Fit
The 12V vs 5V heated apparel system choice reshapes your cost stack, warranty reserve, box size, and channel mix — the single most consequential product decision in 2026.
| Axis | 12V System | 5V System |
|---|---|---|
| Battery cost (FOB) | $5.20–$6.80 (7.4V, 5000 mAh) | $2.40–$3.20 (5V power bank) |
| Heat output (watts) | 18–22 W (5-zone) | 6–10 W (3-zone) |
| Run time (medium heat) | 5–7 hours | 3–5 hours |
| Charger included | Yes (proprietary) | USB-C cable only |
| Wash-cycle rating | 30–50 cycles | 50–80 cycles |
| Box size (apparel + battery) | Large (2 cartons) | Small (1 carton) |
| 3PL pick fee | $3.10/unit | $1.85/unit |
| MSRP floor (US 2026) | $89.99 | $59.99 |
| Best channel | Workwear, outdoor specialty | Lifestyle DTC, urban commuter |
| Compliance complexity | UN 38.3 + UL | UN 38.3 + UL simpler |
For a fall 2026 program with limited capital, 5V is the lower-risk bet. The 12V portfolio wins on technical credibility but burns 2.4x more working capital tied up in battery inventory. A typical 2,500-unit SKU split runs 40% 12V hero jacket, 25% 12V mid glove, 35% 5V lifestyle vest.
Heated Apparel Manufacturer Wholesale Tier Ladder: 500 / 1000 / 2500 / 5000 Units
Your heated apparel wholesale quote ladder should not be a smooth curve — it should have step-changes at strategic MOQ thresholds.
| Tier | Units | FOB Discount vs Tier 1 | Payment Term | Lead Time |
|---|---|---|---|---|
| Tier 1 | 500 | 0% (baseline) | 30% TT deposit, 70% before ship | 75 days |
| Tier 2 | 1,000 | 4–6% | 30/70 | 65 days |
| Tier 3 | 2,500 | 9–13% | 30/70 or LC at sight | 60 days |
| Tier 4 | 5,000 | 15–19% | LC 30 days or OA 60 | 55 days |
| Tier 5 | 10,000+ | 22–28% | OA 90 days | 50 days |
The biggest jump is between Tier 3 and Tier 4 — that’s where the heated apparel manufacturer is willing to lock a production line and share real margin. For most independent retailers, Tier 3 (2,500 units across 3 SKUs) is the sweet spot.
Hidden Costs in Heated Apparel OEM Quotes: Compliance, Tooling, Artwork
The heated apparel OEM quote can balloon by 6–12% post-signature if you don’t surface these upfront.
| Hidden Cost | Typical Range | When It Hits |
|---|---|---|
| CPSIA testing (US children’s wear) | $1,800–$3,500/style | Pre-production |
| GPSR product safety representative (EU) | $450–$900/SKU/year | First shipment |
| UKCA marking + documentation | $300–$700/SKU | First shipment |
| UN 38.3 battery transport certification | $2,200–$4,500/battery model | Pre-production |
| UL / ETL listing for charger + battery | $3,500–$6,500/model | Pre-production |
| Custom tooling (zipper pull, button mold) | $1,500–$4,500/tool | At PO |
| Artwork setup (screen print, embroidery) | $80–$220/color/style | At PO |
| Compliance labeling (FCC, CE, UKCA tags) | $0.18–$0.35/unit | Production |
| Retail packaging + barcoded polybag | $0.45–$0.95/unit | Production |
A vertically integrated heated apparel supplier absorbs 60–80% of these in overhead — part of the 18–24% landed cost savings they offer. A broker passes every line through to you.
Heated Apparel Margin Waterfall by Retail Channel: Channel-Level Margin Variance
Different channels demand different heated apparel pricing postures, each flowing through a different heated apparel margin waterfall. A blended “average” price strategy is a margin leak.
| Channel | Wholesale FOB | Landed | Wholesale Price | MSRP | Net Contribution |
|---|---|---|---|---|---|
| Outdoor specialty | $19.50 | $24.80 | $39.00 | $79.99 | 30.1% |
| Big-box workwear | $19.50 | $24.80 | $34.50 | $69.99 | 19.8% |
| Lifestyle DTC | $22.40 | $27.60 | n/a (DTC) | $129.00 | 42.5% |
| Catalog (cold-season) | $21.00 | $26.40 | $42.00 | $89.99 | 26.4% |
| Amazon FBA | $19.50 | $24.80 | $36.00 (FBM) | $79.99 | 14.6% |
Amazon FBA math is brutal — fees plus storage plus returns plus advertising push net contribution below 15%. Only run Amazon on closeout inventory or on 5V lifestyle SKUs anchored at $59.99.
Retail Buyer Heated Apparel Guide to Negotiation: 5-Step Vendor Cost Reduction
Every heated apparel buyer should run this 5-step playbook before signing a PO in 2026.
| Step | Action | Typical Savings |
|---|---|---|
| 1. Reverse-engineer the FOB | Ask for the 9-line breakdown; benchmark each | Surfaces 4–7% overcharge |
| 2. Tier mix leverage | Quote 2,500 units but signal 5,000 ability | 5–9% on Tier 3 base |
| 3. Cell brand swap | Accept BAK or EVE cells instead of LG/Samsung | $1.20–$2.40/unit |
| 4. Packaging simplification | Drop retail box, use polybag + belly band | $0.40–$0.70/unit |
| 5. Payment term trade | Accept OA 60 for 2.5% additional discount | 2–3% on FOB |
The 5 steps are cumulative — running all five typically yields 14–18% total FOB reduction versus your first quote. Always do step 1 first; if the vendor refuses to share cost lines, walk away before steps 2–5.
8-Row Vendor Pool Scorecard: Cost / Lead Time / Quality / Capacity / Compliance
Use this 8-row scorecard to qualify your heated apparel wholesale vendor pool. Score each axis 1–5 (5 = best).
| Vendor | Cost | Lead Time | Quality | Capacity | Compliance | Communication | Total |
|---|---|---|---|---|---|---|---|
| V1 — Vertically integrated OEM | 5 | 3 | 4 | 5 | 4 | 3 | 24 |
| V2 — Garment OEM + 3rd-party battery | 4 | 4 | 5 | 4 | 4 | 4 | 25 |
| V3 — Battery OEM + outsourced garment | 3 | 3 | 3 | 4 | 5 | 3 | 21 |
| V4 — Trading company broker | 2 | 5 | 2 | 5 | 2 | 5 | 21 |
| V5 — Western brand OEM partner | 2 | 4 | 5 | 2 | 5 | 5 | 23 |
| V6 — Vietnam mid-tier OEM | 4 | 3 | 4 | 4 | 3 | 4 | 22 |
| V7 — Bangladesh value OEM | 5 | 2 | 3 | 5 | 2 | 3 | 20 |
| V8 — Mexico nearshoring startup | 3 | 5 | 4 | 2 | 4 | 4 | 22 |
The score is a starting filter, not an oracle. Your shortlist should combine a top-2 finisher (V2 here) with a backup tier-3 contender (V6) for redundancy.
Heated Apparel Pricing Seasonality: Pre-Order vs Spot, Fall Push vs Q1 Replenishment
Heated apparel pricing has a strong seasonal dimension. Pre-orders in Q1–Q2 for fall delivery carry the deepest discounts; spot orders in Q3 carry 6–12% premiums.
- **Jan–Mar (pre-order for fall):** −8% to −14% FOB. Highest forecast risk. Best for established SKUs.
- **Apr–Jun (standard production):** −3% to −6% FOB. Moderate inventory risk. Best for refresh programs.
- **Jul–Aug (fall push):** +6% to +12% FOB. Low risk. Best for replenishment and hot sellers.
- **Sep–Nov (in-season spot):** +12% to +22% FOB. Very low risk. Emergency restock only.
- **Dec–Feb (Q1 closeout):** −15% to −25% FOB. High next-year carryover risk. Off-price channels only.
The disciplined buyer places 70% of fall volume in pre-order (Jan–Mar), 20% in standard production (Apr–Jun), and reserves 10% for spot. That 70/20/10 split optimizes heated apparel pricing across the year.
LC vs OA Pricing Tie-In: Payment Term Discount Math for Heated Apparel Wholesale
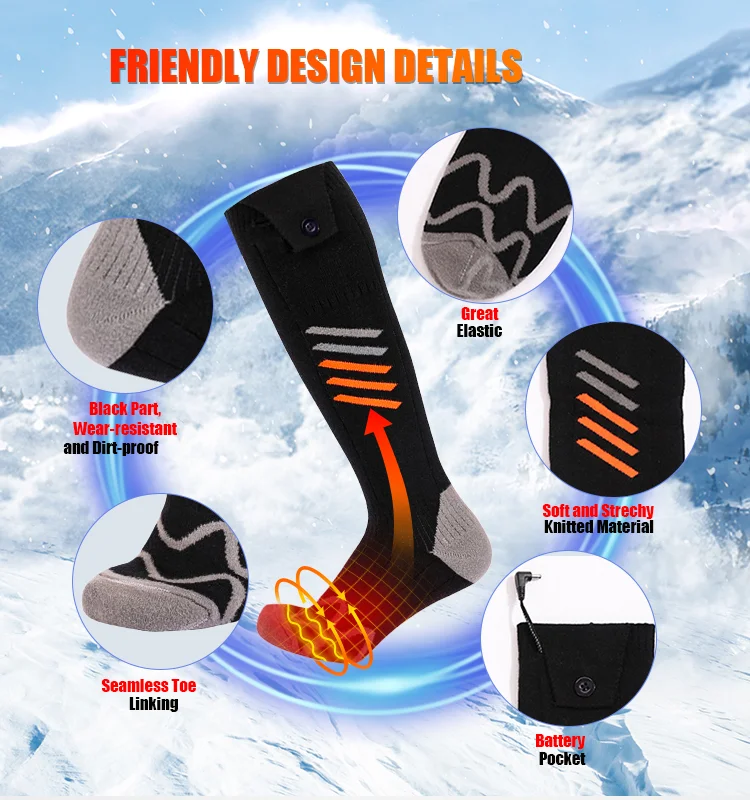
imissky Industrial Co., Ltd – Heated socks OEM/ODM manufacturer since 2018
The final lever in heated apparel pricing is payment terms. Vendors discount hard for Open Account (OA) terms because it shifts working capital off their books.
| Term | Vendor Cash Flow | Typical FOB Discount | Annualized Cost of Capital |
|---|---|---|---|
| 30% TT deposit + 70% before ship | Fast | 0% (baseline) | 0% |
| LC at sight | Fast | 0–1% | 1–2% |
| LC 30 days | Medium | 1–2% | 2–3% |
| LC 60 days | Slow | 2–3% | 3–4% |
| LC 90 days | Slower | 3–4% | 4–5% |
| OA 30 days | Slow | 2–3% | 4–5% |
| OA 60 days | Slowest | 4–6% | 6–8% |
| OA 90 days | Longest | 6–9% | 9–12% |
If your borrowing cost is 8%, the OA 60-day 5% discount is a wash. If your borrowing cost is 12%, OA 60-day wins by ~2 points. This LC vs OA pricing tie-in math is the bridge between financing strategy (cycle 2 slot 3) and pricing strategy (slot 5).
> A vertically integrated heated apparel supplier with in-house battery + garment production typically offers the deepest OA discounts because their own working capital cost is lower than the merchant exporter’s.
12V vs 5V Heated Apparel System Risk Map: 7 Pitfalls Retail Buyers Repeat
Beyond structural pricing levers, retail buyers consistently lose margin to seven recurring pitfalls — most trace back to the 12V vs 5V heated apparel system choice upstream. Use this as a pre-PO checklist for your heated apparel margin waterfall.
- Cell downgrade without notice — specify cell brand + batch traceability ($1.80–$3.20/unit).
- Wrong plug for region (US/EU/UK) — SKU-level plug spec avoids $0.90–$2.40 rework.
- US customs mis-classification (6101 vs 6110) — lock HTS code in vendor agreement ($0.60–$1.40/unit).
- Battery BMS lacking UN 38.3 — demand certificate before ship (total-shipment-hold risk).
- 12V vs 5V spec mismatch across SKUs — SKU-level spec matrix prevents $4.50 reverse logistics.
- Lead-time slip in Q3 peak — 70/20/10 pre-order discipline avoids $5.20/unit airfreight conversion.
- Markdown overcommit on fall push — tighter initial PO + reorder trigger caps leak at 8–14%.
These are the seven reasons a clean heated apparel pricing model can still produce 22% net contribution instead of the planned 30%.
Conclusion: Building a 2026 Heated Apparel Pricing Strategy for Retail Buyers
A defensible 2026 heated apparel pricing strategy has four legs. Decompose every quote into the 9-line cost stack and refuse to negotiate on a single FOB. Build the heated apparel landed cost model with the 3-layer bridge and benchmark against US/EU/UK. Run the heated apparel margin waterfall from FOB through MSRP to net contribution to defend markup. Layer in the 12V vs 5V heated apparel system decision, payment-term discounts, and seasonality to compound savings.
The five OEM archetypes give you different FOB baselines; the 8-row vendor pool scorecard filters them. The 5-step negotiation playbook shaves another 14–18% off your first quote. The LC vs OA math determines whether payment terms are a tailwind or a drag.
Run all of this and your 2026 program should land at 28–34% net contribution on outdoor specialty, 18–22% on big-box, and 38–46% on DTC — even in a freight-inflation environment. That is the bar. Anything below means the FOB quote was right, but the heated apparel pricing strategy was not.
FAQ: Heated Apparel Pricing for Retail Buyers
What is a typical MSRP for heated apparel in 2026?
Outdoor specialty: $79.99–$129.99 jackets, $59.99–$89.99 vests, $39.99–$59.99 gloves. Workwear: $89.99–$149.99. DTC 5V vests anchor at $59.99–$79.99.
What is the landed cost formula for heated apparel?
Landed = FOB + Ocean Freight + Marine Insurance (0.3% of CIF) + Duty (HTS × CIF) + Broker Fee + Drayage + Warehousing + Inbound QC + 3PL Pick Fee. A $19.50 FOB jacket lands ~$24.80 in the US.
12V vs 5V for retail — which wins?
12V for outdoor specialty and workwear (heat output, run-time). 5V for lifestyle DTC, urban commuter, and entry-level outdoor (box size, price, battery simplicity). Many retailers run both.
What is the difference between FOB and landed cost?
FOB = vendor’s loading-port price. Landed = all-in cost on your US/EU/UK dock including freight, insurance, duty, broker fees, drayage, warehousing, inbound QC, and 3PL pick fees. FOB starts the conversation; landed drives margin math.
How do the 5 OEM vendor archetypes differ on pricing?
Vertically integrated OEMs = lowest FOB, highest MOQ. Garment + 3rd-party battery = mid FOB, strong apparel. Battery-led OEMs = strong battery, weaker garments. Brokers = highest FOB, low MOQ. Western-brand OEM partners = premium FOB, mature compliance.
What hidden costs should I expect in an OEM quote?
Compliance testing ($1,800–$6,500/model), tooling ($1,500–$4,500/tool), artwork ($80–$220/color), certification (UN 38.3, UL, CE, UKCA), retail packaging ($0.45–$0.95/unit), and labeling ($0.18–$0.35/unit). Vertically integrated suppliers absorb most of these.
Best negotiation levers with a heated apparel vendor?
Reverse-engineer the 9-line cost stack, leverage tier mix (2,500-unit quote with 5,000-unit signal), accept BAK/EVE cells, simplify packaging, trade payment terms for additional FOB discount. Cumulative savings reach 14–18%.
What margin should a retail buyer expect on heated apparel?
Outdoor specialty: 28–34% net contribution. Big-box workwear: 18–22%. Lifestyle DTC: 38–46% before CAC. Amazon FBA: 14–18% after FBA fees.
How does retail channel change my pricing strategy?
Outdoor specialty supports higher MSRP and full warranty reserve. Big-box demands lower wholesale and minimal return allowance. DTC supports premium MSRP but requires marketing budget. Amazon needs the tightest cost discipline due to FBA fees.
Should I take the LC vs OA payment-term discount?
Compare to your borrowing cost. If cost of capital is 8% and OA 60-day discount is 5%, it’s a wash. If cost of capital is 12%, OA 60 wins by ~2 points annualized. Run the math per PO.
When is peak season pricing for heated apparel?
Peak retail demand: October–December. Peak factory pressure: June–August. FOB premiums in Q3 run 6–12%; in-season spot orders can carry 12–22% premiums.
When should I buy off-season?
Pre-order in Q1 (Jan–Mar) for deepest discounts (8–14%) on fall delivery. Closeout buys in Dec–Feb for next-year carryover at 15–25% off, ideally for off-price channels.