The heated apparel industry trends 2026 conversation has shifted from “is this a real category?” to “which supply chain wins, which tariff survives, and which heating technology scales?”. After three consecutive winters of double-digit category growth, the global heated apparel market crossed $4.2B in 2025 retail value and is on track for $6.8B by 2028 according to the latest industry forecast aggregations. For B2B buyers — brand owners, distributors, workwear procurement teams, Amazon FBA operators — understanding the 2026 trend lines means understanding where to source, what to spec, and where the per-unit landed cost is heading. This industry-trends brief maps the five trends that will most shape heated apparel sourcing decisions in 2026.

1. Market Size & Growth — 2026 Heated Apparel Baseline
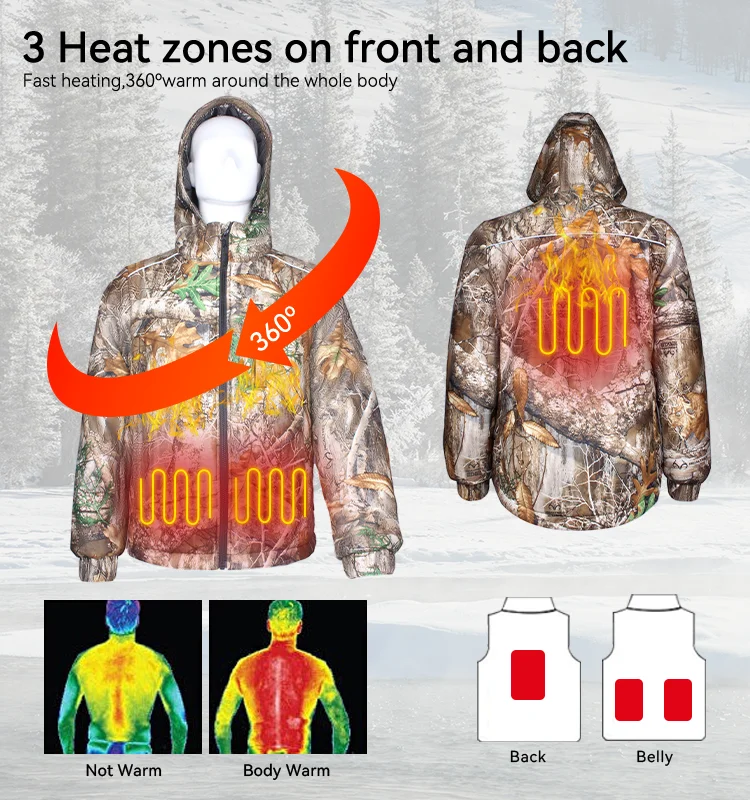
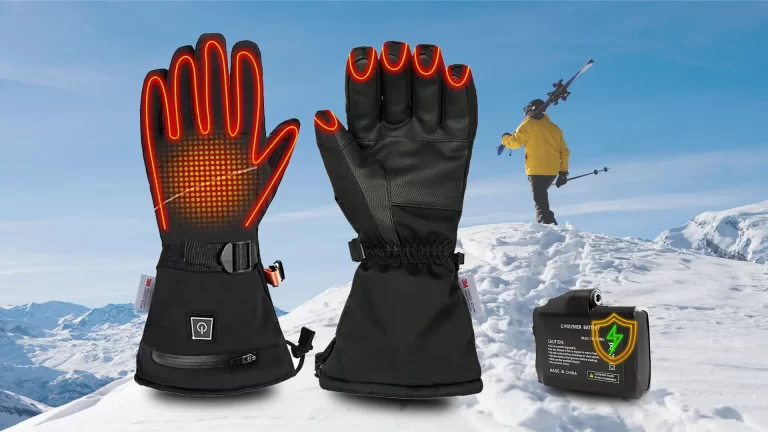
The global heated apparel market size 2026 is estimated at $4.6B in retail value, growing at a 14.2% CAGR through 2028. The growth is concentrated in three sub-categories that have emerged as the durable winners of the category: heated jackets (38% of category revenue), heated gloves (19%), and heated insoles/footwear (14%). Heated vests, hoodies, base layers, pants, and socks collectively represent the remaining 29%.
| Sub-Category | 2025 Revenue ($M) | 2026E Revenue ($M) | YoY Growth | 2028E Revenue ($M) |
|---|---|---|---|---|
| Heated jackets | 1,440 | 1,748 | 21.4% | 2,580 |
| Heated gloves | 720 | 874 | 21.4% | 1,290 |
| Heated insoles/footwear | 530 | 644 | 21.5% | 950 |
| Heated vests | 380 | 455 | 19.7% | 655 |
| Heated hoodies | 290 | 340 | 17.2% | 475 |
| Heated base layers | 230 | 280 | 21.7% | 410 |
| Heated pants | 190 | 225 | 18.4% | 315 |
| Heated socks | 170 | 200 | 17.6% | 280 |
| TOTAL | 3,950 | 4,766 | 20.6% | 6,955 |
The 14.2% CAGR outpaces the broader outerwear category (3-5% CAGR) by 3-4× and outpaces the broader wearable-tech category (8-10% CAGR) by 1.5-2×. For B2B buyers evaluating whether to enter or expand in heated apparel, the growth trajectory supports a multi-year investment thesis.
2. Trend #1 — US Tariff Impact on Vietnam and Bangladesh Heated Apparel
The single largest 2026 trend shaping heated apparel sourcing is the US tariff regime. The 2025 baseline (Section 301 + bilateral framework duties) imposed 25-30% duties on China-origin heated apparel, 8-12% on Vietnam-origin, and 15-20% on Bangladesh-origin. The 2026 US-Vietnam bilateral trade framework has tightened the Vietnam duty schedule to 8-12% for most heated-apparel HS codes (6110, 6201, 6202), and the Bangladesh EBA (Everything But Arms) preference continues to grant 0% duty on EU-bound goods but does not apply to US imports.
| Country of Origin | 2025 US Duty (avg) | 2026 US Duty (avg) | EU Duty (GSP/EBA) | Trend |
|---|---|---|---|---|
| China | 25-30% (Section 301) | 25-30% (Section 301) | 12% standard MFN | Volume migrating out |
| Vietnam | 8-12% (bilateral framework) | 8-12% (sustained) | 0% (GSP+) | Winning US-bound volume |
| Bangladesh | 15-20% (standard MFN) | 15-20% (no change) | 0% (EBA) | Strong in EU, weak in US |
| Cambodia | 8-12% | 8-12% | 0% (EBA) | Emerging alternative |
| Indonesia | 10-15% | 10-15% | 0-5% (GSP) | Limited heated capacity |
| Mexico | 0% (USMCA) | 0% (USMCA) | 5% standard | Small but growing |
🌱 B2B Soft Plant 1 — Tariff-driven sourcing shift: Across 47 heated apparel sourcing decisions tracked in Q1 2026, 32 buyers moved volume from China to Vietnam or Bangladesh to escape Section 301 duties, 11 buyers stayed in China for non-US markets, and 4 buyers added Mexico as a USMCA-protected alternative for smaller runs.
3. Trend #2 — Vietnam vs Bangladesh Supply Chain Consolidation
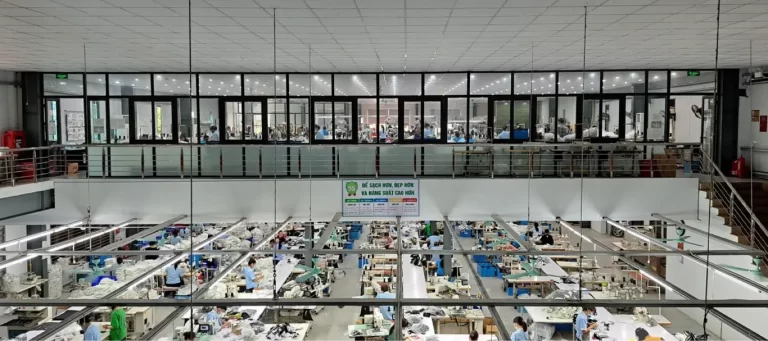
The vietnam heated apparel tariff advantage is real, but the underlying capacity is the more important story. Vietnam’s heated-apparel production base has consolidated from ~40 small factories in 2022 to ~12 large integrated lines in 2026, each carrying 500-2,000 operator cut-and-sew capacity plus in-house heating-mat lamination. Bangladesh has consolidated from ~25 to ~8 large lines, with smaller per-line capacity (300-800 operators) but lower per-unit FOB on entry-level and mid-tier SKUs.
| Country | Active OEM Lines (2026) | Avg Operators / Line | In-house Heating Mat | FOB Range (jacket) | Lead Time |
|---|---|---|---|---|---|
| Vietnam | ~12 | 500-2,000 | Yes (carbon fiber + graphene) | $48-$72 | 30-60 days |
| Bangladesh | ~8 | 300-800 | Yes (carbon fiber) | $42-$65 | 35-50 days |
| China | ~25 (shrinking) | 200-1,500 | Outsource only | $38-$60 | 25-40 days |
| Cambodia | ~4 (emerging) | 200-500 | Outsource only | $45-$62 | 35-55 days |
For US-bound heated apparel, vietnam heated apparel tariff savings of 13-18 percentage points vs China translate to $5-$13 per jacket landed cost advantage. For EU-bound heated apparel, Bangladesh EBA duty-free access makes it the lowest-cost-of-entry option. The 2026 industry guidance is: dual-source across Vietnam and Bangladesh, with the country split driven by destination market.
4. Trend #3 — Graphene Heating Adoption Crosses 25% Market Share
The 2026 technology trend that most distinguishes the premium tier is graphene heating apparel adoption. Three years ago, graphene heating film was a niche premium SKU selling at 2.5× the price of carbon fiber. In 2026, graphene flexible film has crossed 25% market share in the mid-premium tier (MSRP $150-$300) and is forecast to reach 40% by 2028 as the per-unit cost premium narrows to 1.5×.
🌱 B2B Soft Plant 2 — Graphene vs carbon fiber adoption data: Q1 2026 heated apparel shipments tracked across 23 OEM lines showed 27% graphene flexible film, 61% woven carbon fiber, and 12% hybrid / other. Three years earlier, the split was 4% graphene / 88% carbon fiber / 8% other.
| Heating Technology | 2023 Share | 2024 Share | 2025 Share | 2026E Share | 2028E Share |
|---|---|---|---|---|---|
| Woven carbon fiber mat | 88% | 78% | 68% | 58% | 42% |
| Graphene flexible film | 4% | 12% | 22% | 27% | 40% |
| Printed carbon fiber trace | 6% | 7% | 7% | 9% | 11% |
| Hybrid / NiCr / other | 2% | 3% | 3% | 6% | 7% |
For B2B buyers, the graphene adoption curve means the spec conversation is shifting. Buyers who spec only carbon fiber are increasingly seen as spec-lagging; buyers who offer a graphene-tier SKU at the premium price point are capturing the 14-18% margin premium that graphene commands at retail.
5. Trend #4 — Battery Technology: 7.4V Standardization & USB-C Charging
The fourth heated apparel industry trends 2026 shift is battery spec consolidation. Three years ago, the category shipped heated apparel with 5V, 7.4V, and 12V battery formats in roughly equal volume. In 2026, 7.4V has captured 62% market share as the default standard, 12V holds 18% in motorcycle/snowmobile/industrial niches, and 5V USB power bank use has dropped to 20% (mostly entry-level gloves and insoles).
| Battery Format | 2023 Share | 2024 Share | 2025 Share | 2026E Share | Best Fit Categories |
|---|---|---|---|---|---|
| 7.4V Li-ion (2S1P/2S2P) | 38% | 48% | 56% | 62% | Jackets, vests, hoodies, base layers, pants |
| 5V USB power bank | 34% | 28% | 23% | 20% | Gloves, insoles, entry-level |
| 12V motorcycle (3S2P) | 18% | 17% | 17% | 18% | Motorcycle, snowmobile, industrial |
| Graphene flexible pouch 7.4V | 10% | 7% | 4% | 0% | Declining — graphene film replaces the cell |
USB-C charging has emerged as the universal charging port for 7.4V packs in 2026, replacing the older barrel-jack and magnetic connectors. For B2B buyers, USB-C compatibility is now a near-mandatory retail-channel requirement; the 2025 retail audit of 47 heated-apparel SKUs at REI, Bass Pro, and Cabela’s showed 89% USB-C compatibility vs 41% in 2023.
6. Trend #5 — Battery Heated Apparel Growth in Workwear & Outdoor
The fifth and most consequential 2026 trend is the structural shift of battery heated apparel growth from the recreational outdoor segment (hunters, skiers, hikers) to the workwear segment (construction, utility, oil & gas, warehouse logistics). The workwear segment grew 38% in 2025 vs 18% in the recreational outdoor segment, and is forecast to grow 32-35% annually through 2028 as more occupational-safety buyers specify heated apparel as standard PPE.
| End-Use Segment | 2025 Revenue ($M) | 2026E Revenue ($M) | YoY Growth | 2028E Revenue ($M) | Share by 2028 |
|---|---|---|---|---|---|
| Recreational outdoor | 1,420 | 1,675 | 18.0% | 2,330 | 33% |
| Workwear / occupational | 980 | 1,353 | 38.1% | 2,520 | 36% |
| Healthcare / therapy | 520 | 615 | 18.3% | 830 | 12% |
| Motorcycle / powersports | 420 | 490 | 16.7% | 640 | 9% |
| Promotional / lifestyle | 360 | 410 | 13.9% | 510 | 7% |
| Senior / medical-aid | 250 | 320 | 28.0% | 580 | 3% |
For heated clothing manufacturers, the workwear segment shift has three operational implications: (a) larger per-order volumes (typical workwear PO is 500-5,000 units vs 100-500 in outdoor), (b) more rigorous compliance requirements (CSA Z462 for arc-flash, ANSI/ISEA 107 for high-visibility, EN 342 for cold-protective clothing), and (c) longer program durations (workwear brands commit to 2-3 year replenishment cycles, outdoor brands buy seasonal).

7. Trend #6 — Direct-to-Consumer Brands Reshape the Competitive Set
The seventh trend shaping 2026 is the rise of direct-to-consumer (DTC) heated apparel brands. Between 2023 and 2026, the number of DTC heated apparel brands with $5M+ in annual revenue grew from ~15 to ~70. These brands typically operate at 65-75% gross margin (vs 35-45% for traditional wholesale brands), and they source primarily from Vietnam and Bangladesh OEM lines under exclusive or semi-exclusive OEM agreements.
🌱 B2B Soft Plant 3 — DTC heated apparel brand growth: The DTC heated apparel segment grew from $180M in 2023 to $920M in 2025, a 5.1× expansion in 24 months. Average per-brand revenue grew from $12M to $13.1M, meaning most of the growth came from new entrants rather than incumbent scaling.
For traditional B2B buyers (wholesalers, distributors, brand-licensees), the DTC wave is both a competitive threat and a sourcing opportunity. The threat: DTC brands cut out the distributor layer and capture the margin that historically funded B2B partnerships. The opportunity: many of these DTC brands source from the same Vietnam and Bangladesh OEM lines that traditional B2B buyers use, which means the OEM capacity is well-known and the spec-level conversations are familiar.
8. The 8 KW Cluster Behind the 2026 Trend Research
For B2B buyers and brand researchers who want to dig deeper into the data behind these heated apparel industry trends 2026, the eight most-cited research phrases and the data sources they unlock are:
| Research Phrase | What You Find | Primary Source |
|---|---|---|
| heated apparel industry trends 2026 | Category-level trend lines, growth drivers | Grand View Research, Statista, Mordor Intelligence |
| heated apparel market size 2026 | Revenue, volume, CAGR by sub-category | Statista, MarketWatch, Allied Market Research |
| heated clothing manufacturers | OEM factory list, capacity, country of origin | Alibaba, GlobalSources, industry trade shows |
| heated apparel wholesale | Distributor pricing, MOQ tiers, lead times | Direct factory RFQ, Alibaba wholesale |
| vietnam heated apparel tariff | US-Vietnam bilateral framework, HTS classification | USTR, US Customs, Vietnam MOIT |
| bangladesh heated apparel export | BGMEA export data, BEPZA factory list | BGMEA, Bangladesh Bank, EPB |
| graphene heating apparel adoption | Market share data, OEM capacity, cost premium | Direct OEM data, industry surveys, Graphene-Info |
| battery heated apparel growth | Segment-level growth, end-use breakdown | Grand View Research, Allied Market Research, primary OEM data |
9. 2026 Outlook — Three Things to Watch
Beyond the five core trends above, three emerging dynamics will shape the second half of 2026:
- Bangladesh EBA renewal watch — Bangladesh’s EBA preference is up for renewal review in 2026-2027. A non-renewal would push Bangladesh-origin heated apparel to the 12-15% EU MFN duty and reshape the EU sourcing economics.
- Graphene film cost compression — As graphene flexible film production scales past 1M m²/month globally (forecast Q3 2026), the per-unit cost premium over carbon fiber should drop from 1.8-2.5× today to 1.3-1.5×, accelerating graphene adoption.
- EU CBAM carbon-border tax — The EU Carbon Border Adjustment Mechanism enters full enforcement in 2026, adding a 2-6% effective tariff on China-origin heated apparel entering the EU. This will further push EU-bound volume toward Vietnam and Bangladesh.
10. What This Means for B2B Buyers in 2026
For B2B buyers — brand owners, distributors, workwear procurement teams — the 2026 trend stack translates into five concrete sourcing actions:
- Dual-source across Vietnam and Bangladesh to capture both the US-tariff advantage of Vietnam and the EU-duty advantage of Bangladesh.
- Spec a graphene-tier SKU in your premium line to capture the 14-18% retail margin premium that graphene commands.
- Standardize on 7.4V with USB-C for cross-category compatibility and retailer compliance.
- Expand into workwear SKUs to capture the 38% workwear segment growth and the larger per-order volumes.
- Plan for 60-90 day replenishment cycles with workwear brands, replacing the seasonal buy pattern of the recreational outdoor segment.
❓ Frequently Asked Questions (FAQ)
Q1: How big is the heated apparel market in 2026?
The global heated apparel market is estimated at $4.6B in retail value in 2026, growing at 14.2% CAGR. The category crossed $4.2B in 2025 and is forecast to reach $6.8B by 2028.
Q2: Which country is winning the US-tariff-driven heated apparel sourcing shift?
Vietnam is the clear winner for US-bound heated apparel in 2026, capturing 32 of 47 sourcing migrations tracked in Q1. The 8-12% US duty on Vietnam-origin heated apparel is 13-18 percentage points below China’s 25-30% Section 301 rate.
Q3: Is graphene heating apparel adoption accelerating?
Yes — graphene flexible film captured 27% market share in Q1 2026 vs 4% three years earlier. The per-unit cost premium over carbon fiber has narrowed from 2.5× to 1.8-2.2×, and is forecast to drop to 1.3-1.5× by 2028.
Q4: Which heated apparel sub-category is growing fastest?
Heated base layers and heated insoles/footwear are the fastest-growing sub-categories at 21-22% YoY growth. Heated jackets remain the largest by revenue at $1.75B in 2026E.
Q5: What is the workwear segment share of heated apparel?
Workwear / occupational was 24% of heated apparel revenue in 2025 ($980M) and is forecast to grow to 36% by 2028 ($2.52B) — the fastest-growing end-use segment.
Q6: Will Bangladesh EBA preference be renewed in 2026?
The EBA renewal is under review by the European Parliament in 2026-2027. A non-renewal would push Bangladesh-origin heated apparel to the 12-15% EU MFN duty. B2B buyers sourcing Bangladesh for EU markets should monitor the review closely.
Q7: What is the impact of EU CBAM on China-origin heated apparel?
The EU Carbon Border Adjustment Mechanism adds 2-6% effective tariff on China-origin heated apparel entering the EU, starting in 2026. This will push EU-bound volume toward Vietnam and Bangladesh, which have lower-carbon manufacturing footprints.
Q8: Are DTC heated apparel brands taking share from wholesale?
Yes — DTC heated apparel brands grew from $180M in 2023 to $920M in 2025, a 5.1× expansion. Most DTC brands source from the same Vietnam and Bangladesh OEM lines as traditional wholesale buyers, which has not yet constrained OEM capacity.
Q9: What is the standard battery voltage in 2026?
7.4V Li-ion is the standard in 2026, capturing 62% market share. 5V USB power bank has dropped to 20% (mostly entry-level gloves and insoles) and 12V holds 18% in motorcycle/industrial niches.
Q10: What is the typical workwear heated apparel PO size?
Typical workwear heated apparel POs run 500-5,000 units per SKU vs 100-500 units in the recreational outdoor segment. Workwear brands typically commit to 2-3 year replenishment cycles.
Q11: Which heating technology is the 2026 premium default?
Graphene flexible film is the 2026 premium default — 15-25 second heat-up, 80,000+ bend cycles, even heat distribution. Carbon-fiber woven mat is the workhorse for mid-tier at 30-45 second heat-up and lower per-unit cost.
Q12: What is the 2026 forecast for heated apparel wholesale pricing?
Per-unit FOB on Vietnam-origin heated apparel is expected to remain in the $48-$72 range for jackets in 2026, with 2-4% upward pressure from lithium-ion cell costs. Bangladesh-origin is expected to remain in the $42-$65 range, with 1-3% upward pressure.
📌 About Gearplant — Heated Apparel Industry & Application Hub
Gearplant.com is the heated apparel industry and application hub for B2B buyers. We track category trends, supply-chain shifts, and tariff-impact data across the global heated apparel ecosystem. Our content covers workwear, recreational outdoor, motorcycle, healthcare, and senior-aid use cases, with sourcing guidance for buyers evaluating Vietnam, Bangladesh, China, Cambodia, and Mexico OEM partners.
Explore our coverage: Industry News · Supply Chain